

Driver Scorecards: How to Rate Driver Performance Fairly with Data
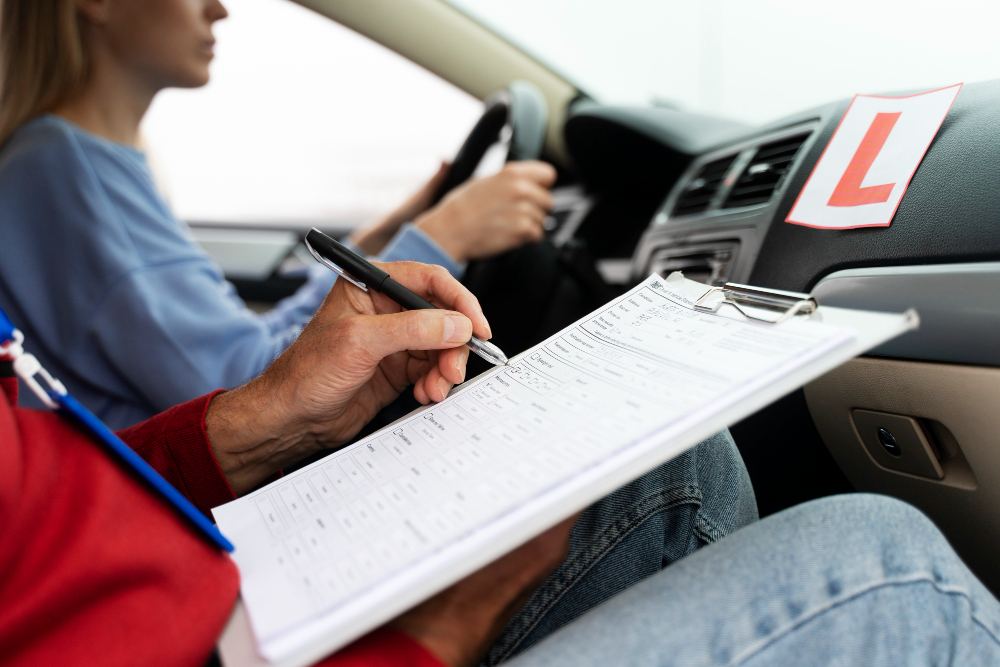
A driver scorecard is a transparent index that rolls multiple signals — safety, efficiency, compliance, and service — into one easy-to-read rating per driver. Instead of debating impressions ("he's careful," "she's fast"), it draws on objective data: telematics and electronic driving logs, dashcams and driver-assistance systems, fuel cards, vehicle inspection reports, and customer feedback.
Typical inputs include speeding against the posted limit, harsh braking, acceleration, and cornering, idle percentage, fuel efficiency, hours-of-service violations, the quality of defect reporting and follow-up, preventable incidents, and on-time delivery.
The craft is in the weighting and normalization — adjusting scores so you compare like with like. A box truck isn't a sedan, an urban round isn't a highway run, and winter isn't summer. Normalized properly, the score reflects the driver's skill and choices, not route luck or vehicle quirks. The outcome is a shared definition of what good driving looks like, and a clear path for every driver to get there.
Why it matters in fleet management
A scorecard aligns drivers, dispatch, safety, and finance around the same behaviors — the ones that reduce crashes and costs.
Drivers self-correct
When drivers know exactly how they're measured, behavior changes without anyone standing over them. Smoother driving lifts fuel efficiency, fewer harsh events extend brake and tire life, and clean logging and inspection habits speed up roadside checks.
Managers coach faster
A scorecard turns raw telematics data into short, focused conversations. Ten minutes on one behavior goal beats an hour of sifting through event logs.
The business gets predictability
Better scores mean fewer claims, less downtime, and more reliable arrival times — and a documented safety trend strengthens your position with insurers and enterprise customers alike.
Retention improves
Scorecards power fair incentives and career pathways — preferred routes, mentor roles, quarterly bonuses — rewarding good work without arbitrarily raising base pay.
Example in practice
A regional distributor launches a scorecard weighted 50% safety, 30% efficiency, and 20% compliance and service. Metrics are normalized by vehicle class and route type: winter months down-weight speed variance on steep grades, and urban routes cap the impact of frequent stops.
Drivers see their weekly score in a mobile app with plain-language guidance — "reduce events more than 10 mph over the limit," "target idle below 8%." In-cab alerts trigger only when risks stack, such as speeding combined with a short following distance. Managers run ten-minute monthly coaching sessions built on 30-second clips and map snippets.
After two quarters: harsh-driving events down 38%, preventable incidents down 23%, fuel cost per mile improved 4% — and the insurer recognizes the trend at renewal. Engagement rises too. Drivers compete on a friendly leaderboard, and maintaining an A-range score unlocks the privilege of bidding on preferred routes.
Desing and weighting
Pick clear pillars. The common four: Safety (events per 100 miles, critical events, preventable crashes), Efficiency (fuel economy, idle percentage, route smoothness), Compliance (hours-of-service violations, inspection report quality), and Service (on-time rate, customer feedback).
Normalize everything. Compare within vehicle class, route type, weather band, and load profile — and penalize only what's within the driver's control. Fairness isn't a nice-to-have; it's what makes the whole system work.
Weight by severity. Briefly running 5–7 mph over the limit on an empty arterial road is not the same as 18 mph over in a school zone. Weight events by context: the posted limit, traffic density, and following distance.
Choose a sensible window. A 30–90 day scoring window balances responsiveness with stability, so one bad afternoon doesn't define a driver. Show a trailing 12-month trend alongside it for context.
Make the formula public. Show drivers the math, with worked examples: how events are counted, when old events stop counting, and how exceptions — time off, emergencies, severe weather — are handled. A score nobody can explain is a score nobody trusts.
Guard against noise. Filter false positives such as GPS glitches and pothole-induced "braking" spikes, and require stacked evidence — for example, eyes off the road plus a closing gap — before flagging distraction. Every false accusation costs more trust than ten fair ones build.
Metrics and benchmarks
Event rate per 100 miles - speeding, harsh braking and acceleration, and cornering, segmented by severity. Look for a steady decline, and for the gap between your best and average drivers to narrow.
Critical-risk index - a weighted count of the highest-severity events: more than 15 mph over the limit, tailgating alerts, red-light violations.
Idle percentage and idle cost per hour - tied to route type and season, coached toward the peer median or a company target.
Energy efficiency - miles per gallon against peers in the same duty cycle; for electric vehicles, miles per kWh with adjustment for climate, since cold weather cuts range.
Compliance health - hours-of-service violations and near-limit warnings avoided, inspection report submission rate, and the time from a reported defect to its repair.
Service reliability - on-time arrival within the customer's window, delivery reattempts, and complaint rate.
Composite trend and variance - month-over-month score improvement, and the spread between depots and managers. A wide gap between depots usually signals a coaching or scheduling problem, not a talent problem.
Rollour and incentives
Pilot, don't surprise. Start with a small group, publish the baseline results, and design thresholds together with drivers and trainers. Fix the obvious edge cases before the fleet-wide launch — the first impression of a scorecard is hard to undo.
Coach with evidence. Keep sessions to ten minutes, focused on one behavior goal, built on a clip or a map. Write the goal down and revisit it in 30 days.
Reward improvement, not just rank. Quarterly bonuses, badges, preferred routes, and mentor opportunities should go to sustained gains — including drivers who will never be #1 overall. A leaderboard that only rewards the top three demotivates everyone else.
Put it where people already look. Surface the score and each driver's two biggest opportunities in the driver app and on the dispatch board, and celebrate depot-level wins in stand-up meetings.
Protect privacy and fairness. Limit who can view inward-facing camera footage, mask passengers, delete routine clips on a schedule, and log every access. Give drivers the ability to add context to an event — an evasive maneuver shouldn't score like reckless driving.
Close the loop. Publish a monthly "you said, we did" note — "adjusted the speed-limit map on County 12," "added stop-start exemptions near the rail crossing." Trust in the scorecard rises fastest when driver feedback visibly changes the system.