

Fuel Monitoring Systems: Track Fleet Fuel Use, Costs, and Fraud
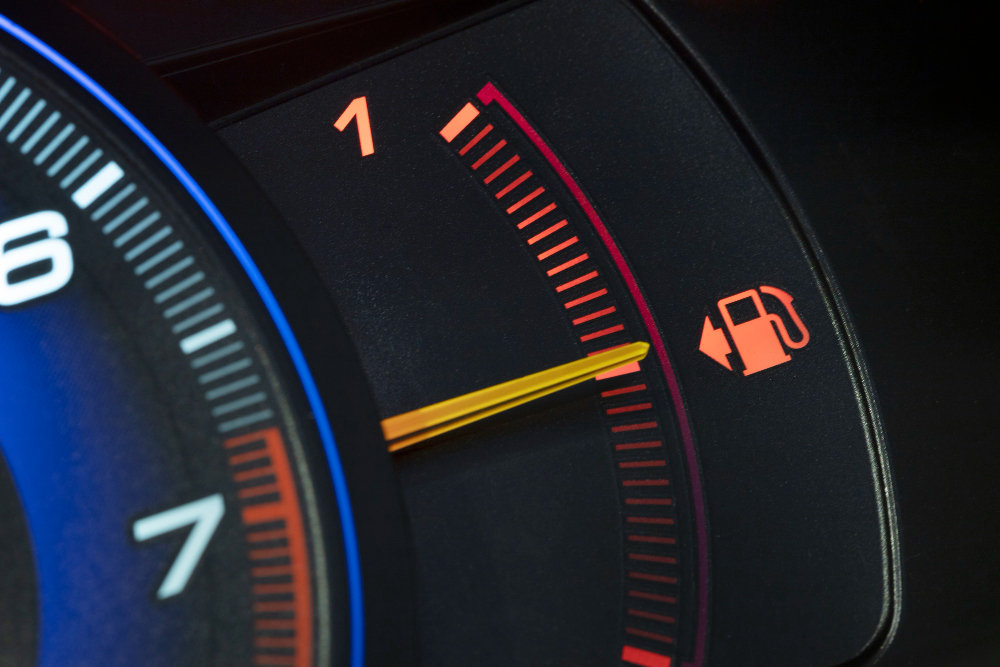
A fuel monitoring system unifies everything that touches fuel - card swipes, engine and telematics data, tank sensors, invoices and rebates, even electric vehicle charging sessions - into a single source of truth.
The system does the stitching automatically. It matches each purchase to a vehicle, driver, and trip; calculates cost per mile; highlights anomalies - such as more liters purchased than the tank can physically hold - and pushes alerts to the people who can act on them. Instead of reconciling spreadsheets against card portals and vendor statements, you get an always-on answer to four questions: what did we buy, where did it go, how efficiently was it used, and what should we do about it.
Mature setups go further. They estimate fuel burned while idling, normalize results by route type and weather so comparisons stay fair, and convert consumption into emissions figures — so finance, operations, and sustainability teams are all looking at the same numbers instead of three versions of the truth.
Why it matters in fleet management
Fuel prices are volatile, and fuel spend is usually the biggest variable cost a fleet carries. Small blind spots become big money at fleet scale. A unified system earns its keep in five ways:
Cutting waste
Avoidable idling, underinflated tires, harsh driving, and poor route design all show up in the fuel data — once the data is clean enough to trust.
Preventing fraud and misuse
Cross-checking card swipes against GPS flags the fills that deserve a second look: fuel purchased when the vehicle wasn't at the station, or the wrong fuel type for the vehicle on the card.
CompSpeeding up month-end closeliance
Automated reconciliation, fuel-tax recovery, and cost allocation by vehicle, route, or customer turn a multi-day accounting chore into a review of exceptions.
Strengthening vendor leverage
When you can benchmark station prices against the local index, supplier negotiations start from data instead of impressions.
Supporting sustainability
Fuel and energy data becomes auditable CO₂ per mile — real figures for reporting, not estimates on a slide.Example in practice
A construction fleet runs pickups, Class 7 trucks, and an on-site fuel tank. The team connects its fuel-card feeds, engine fuel-rate and odometer data, yard-tank sensors, and accounting system to one platform.
The platform matches transactions automatically using location, time, and driver and vehicle IDs, then checks each one against telematics: if the truck wasn't at the station when the card was swiped, the case is flagged. Dashboards show idle fuel per hour, fuel economy by vehicle class, and price paid versus the local index.
Within one quarter, the data surfaces three issues: weekend fills far from any route corridor, underinflated tires dragging down economy on a busy route, and a supplier consistently charging above market in one region. After tightening card rules, coaching drivers, and switching suppliers, fuel cost per mile drops 6%, idle falls 28%, and month-end reconciliation time is cut in half.
Data sources and architecture
Fuel purchases. Card network line items (product, volume, price, merchant), mobile fueling deliveries, and cash receipts captured through a driver app.
Vehicle signals. Fuel rate and odometer readings from the engine control module — the vehicle's onboard computer — plus engine hours, idle minutes, GPS, and the fault codes that hurt economy, such as a failing oxygen sensor.
Tank telemetry. Volume, temperature, and water readings from yard and job-site tanks, reconciled against delivery paperwork so what was billed matches what actually arrived.
EV energy. Charger session logs (kWh, start and stop times, tariff), demand charges, time-of-use rates, and reimbursements for drivers who charge at home.
Pricing and taxes. Local price indexes, rebates, surcharges, and fuel-tax categories for regulatory reporting.
Identity and rules. A clean roster linking each driver, vehicle, and card, plus shift calendars, geofences (virtual boundaries around depots and sites), and exception codes for time off or severe weather.
Warehouse and access. A central data store with role-based dashboards and APIs, so operations, finance, and sustainability each see the view they need — built on the same numbers.
KPIs & alerts
Cost per mile, by route and vehicle — ties fuel spend to the work it produced, and exposes the corridors and customers where the economics are weak.
Fuel economy by vehicle class — trended against peers, with alerts on sudden drops after maintenance or a tire change.
Idle percentage and idle fuel per hour — converted into dollars and CO₂, with alerts on after-hours idling.
Capacity mismatch — more liters purchased than the tank holds, plus tolerance. One of the clearest fraud signals there is.
Telematics mismatch — a card swipe with no vehicle present, or a fill far outside the route corridor.
Price outliers and missed rebates — station price versus the local index, catching the quiet leakage across a fuel network.
Unassigned transactions — purchases missing a driver or vehicle link, surfaced weekly so the books stay clean.
Emissions intensity — CO₂ per mile and in total, by depot and customer, with trendlines that should follow the efficiency gains down.
Implementation tips
Standardize first. Normalize IDs, units (miles or kilometers, gallons or liters), and time zones, and set naming conventions for vehicles, drivers, and cards. Bad identity mapping wrecks trust in every number downstream.
Start with the 80/20. Connect fuel cards and telematics first — that alone delivers matching, fraud detection, and idle visibility. Add tank sensors, EV data, and price indexes in phase two.
Automate the matching. Location and time windows, odometer deltas, and driver PINs should resolve well over 95% of transactions automatically, leaving humans only the true exceptions.
Coach with context. Link idle, harsh events, and fuel economy to specific trips and locations in the driver's scorecard, and recognize improvement — not just the top of the leaderboard.
Validate the data. Check telematics-derived fuel figures against physical fill-to-fill audits on a sample of vehicles each month, and recalibrate when the numbers drift.
Tune rules, not just alerts. If after-hours idle keeps firing, the fix is a depot geofence and an auto-shutdown procedure — not a louder alarm. If price outliers cluster at one network, renegotiate or shift the preferred stations.
Show the ROI. Publish a monthly "fuel wins" snapshot — dollars saved from idle reduction, fraud prevented, and vendor changes — so leadership keeps funding the program.
Include EVs from day one. Track miles per kWh, charging dwell time, and tariff optimization, and compare mixed-fuel routes on an energy-normalized cost basis so diesel and electric can be judged fairly side by side.